***SPERRET FOR SALG - Atlas2 Plus OLED Display
inkl. mva.
The Anybus Atlas2 Plus is a permanent monitoring tool for PROFINET, EtherNet/IP, EtherCAT and PROFIBUS that provides diagnostics information of your industrial network 24/7, displaying it within our intuitive software Osiris. This allows field technicians to ensure uptime, a healthy network and troubleshoot their network before costly downtime can occur. Anybus Osiris Software is included wih perpetual license.
Anybus Atlas2 Plus
The Anybus Atlas2 Plus is a permanent monitoring tool that provides diagnostics information of your industrial network 24/7, displaying it within our intuitive software Osiris. This allows field technicians to ensure uptime, a healthy network and troubleshoot their network before costly downtime can occur.
Whether you’re using PROFINET, EtherNet/IP and EtherCAT, you’ll discover that the Atlas2 Plus gives you a much more connected and predictive approach to machine health monitoring and maintenance.
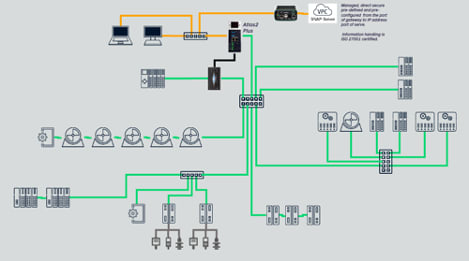
This unique hardware reads industrial ethernet traffic and is single mounted on the DIN-rail in a cabinet connected to the office and factory port.
Anybus Osiris Software is included wih perpetual license.
Distinctive features
- Remote 24/7 monitoring for PROFINET, EtherNet/IP, EtherCAT and PROFIBUS
- Multiple versions of active and passive or active-only monitoring
- Self-learning machine with predictive fault-finding capabilities
- Dynamic graphical and hierarchical displays of a network’s topology
- Scoring mechanism and traffic light alert system for simple insight
- Optional LED display on the device itself for a quick overview
All-in-one solution
- OPC-UA and MQTT compatible to export diagnostic data to SCADA systems
Your benefits
- Helps your company operate more efficiently by providing collective diagnostic oversight of installations with multiple protocols.
- Results in faster troubleshooting and reduced downtime by processes data four times faster than its predecessor Atlas.
- Improves your productivity by analysing data in real-time and providing immediate network overviews, no matter where in the world you are.
- Increases the accuracy of the diagnostic process and maintains your network’s up times by learning automatically from experience.
- Cuts the cost of maintenance by scoring your networks’ health and suggesting likely causes for common and unique faults.
Key Use Cases
- Provides data traffic insight of your industrial network
- Provides an intuitive interface to access data and analyze
Application example:
- Any industrial network with single or mixed network architectures.

Technical specifications
| Processor |
NXP IMX8 QuadMax 4 GB LPDDR4 Memory 16GB eMMC Storage Memory |
| Cooling | Passive Cooling [fanless] |
| Housing | Powder Coated Aluminum [improved heat dissipation] |
| Housing Size | 52w x 130h x 110d |
| Mounting | 1] Din Rail, 3rd party clips 2] Wall mounting optional |
| Screen | Optional: PM-OLED 1,45 inch, 160RGB x 128 Dots, 262 Colors Viewing Allows: network status, and unit settings for easy troubleshooting. |
| Power Supply | 12-24 v DC |
| Relay Contact | 24V/0.5A |
| USB Ports |
2x USB3.0, Type A; 900 mA port 1x USB 2.0, Micro Type B; 500 mA (recovery channel only) |
| Licensing | 1] Single Base license “Full”, with optional upgrade licenses 1] “edge” license, allowing only OPC UA / MQTT communication of data. |
| Active Measurements [no tap] | Yes, unlimited devices |
| Passive Measurements [with TAP] | Yes |
| TAP Communication Load | Recommended 60% or below. |
| OPC UA [Secure] | Yes |
| MQTT [Secure] | Yes |
| Software updates | Yes, upgrade and downgrade |
| Update time | <10minutes |
| Recovery Options | Yes, dual recovery partition |


